

What it is
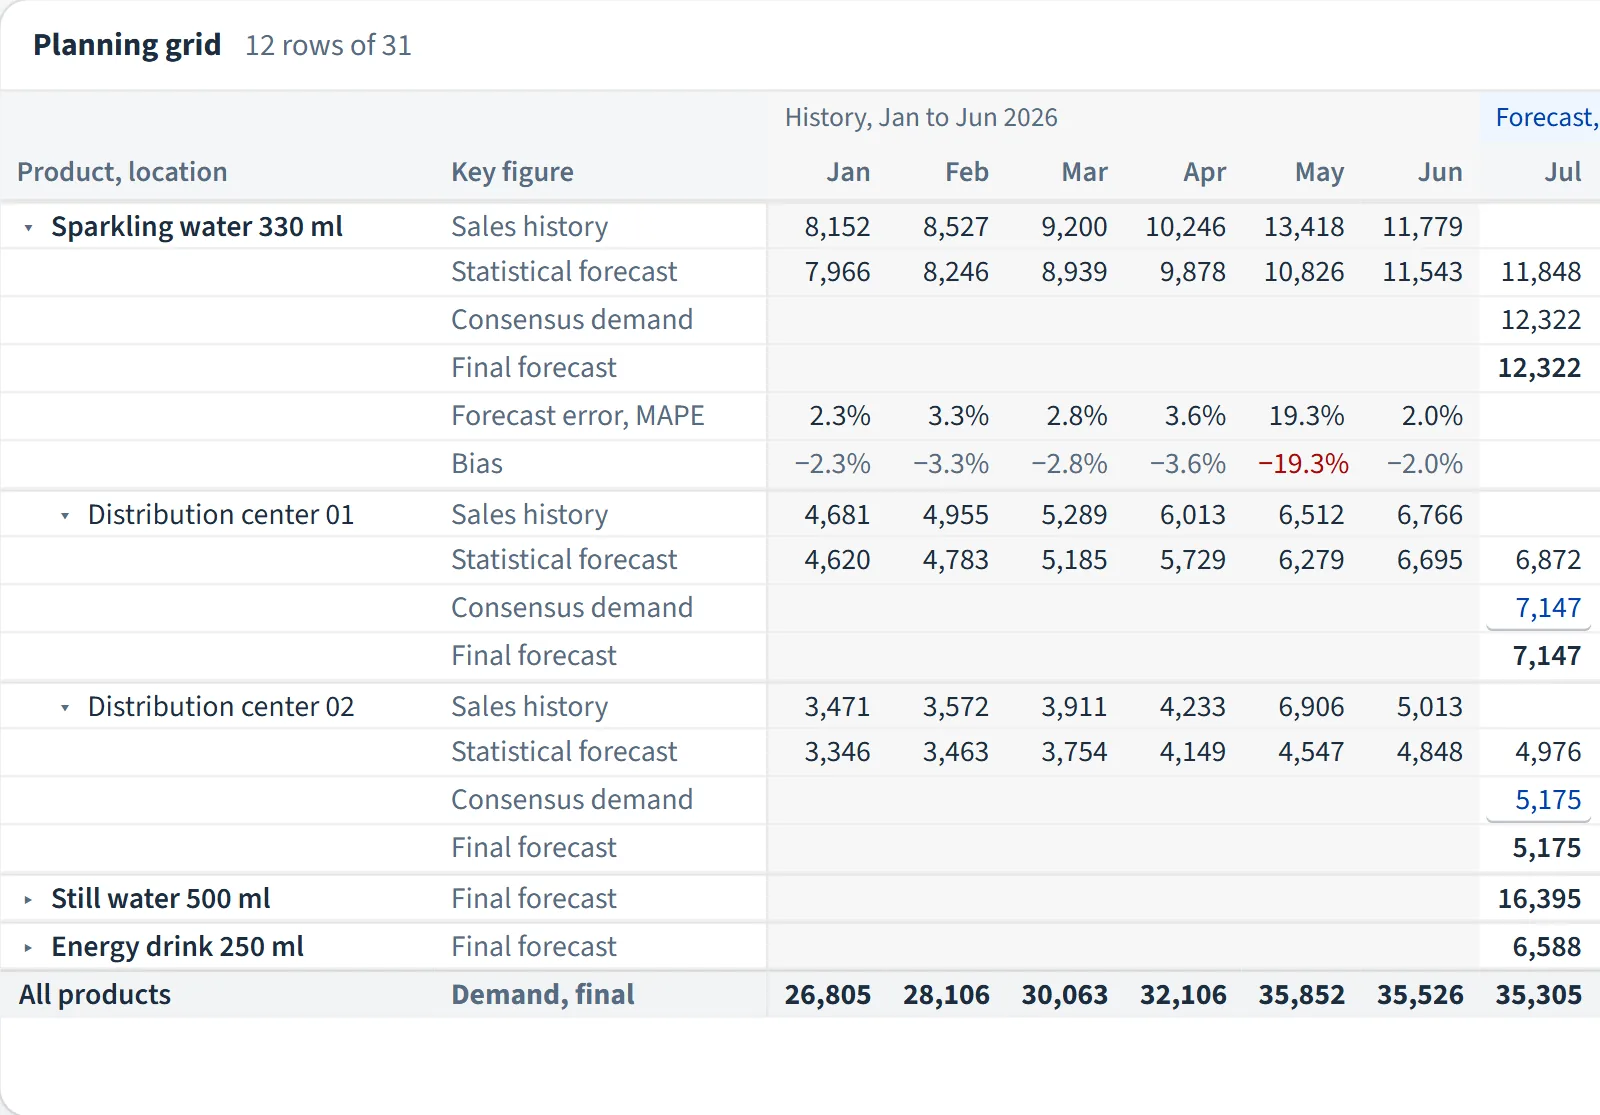
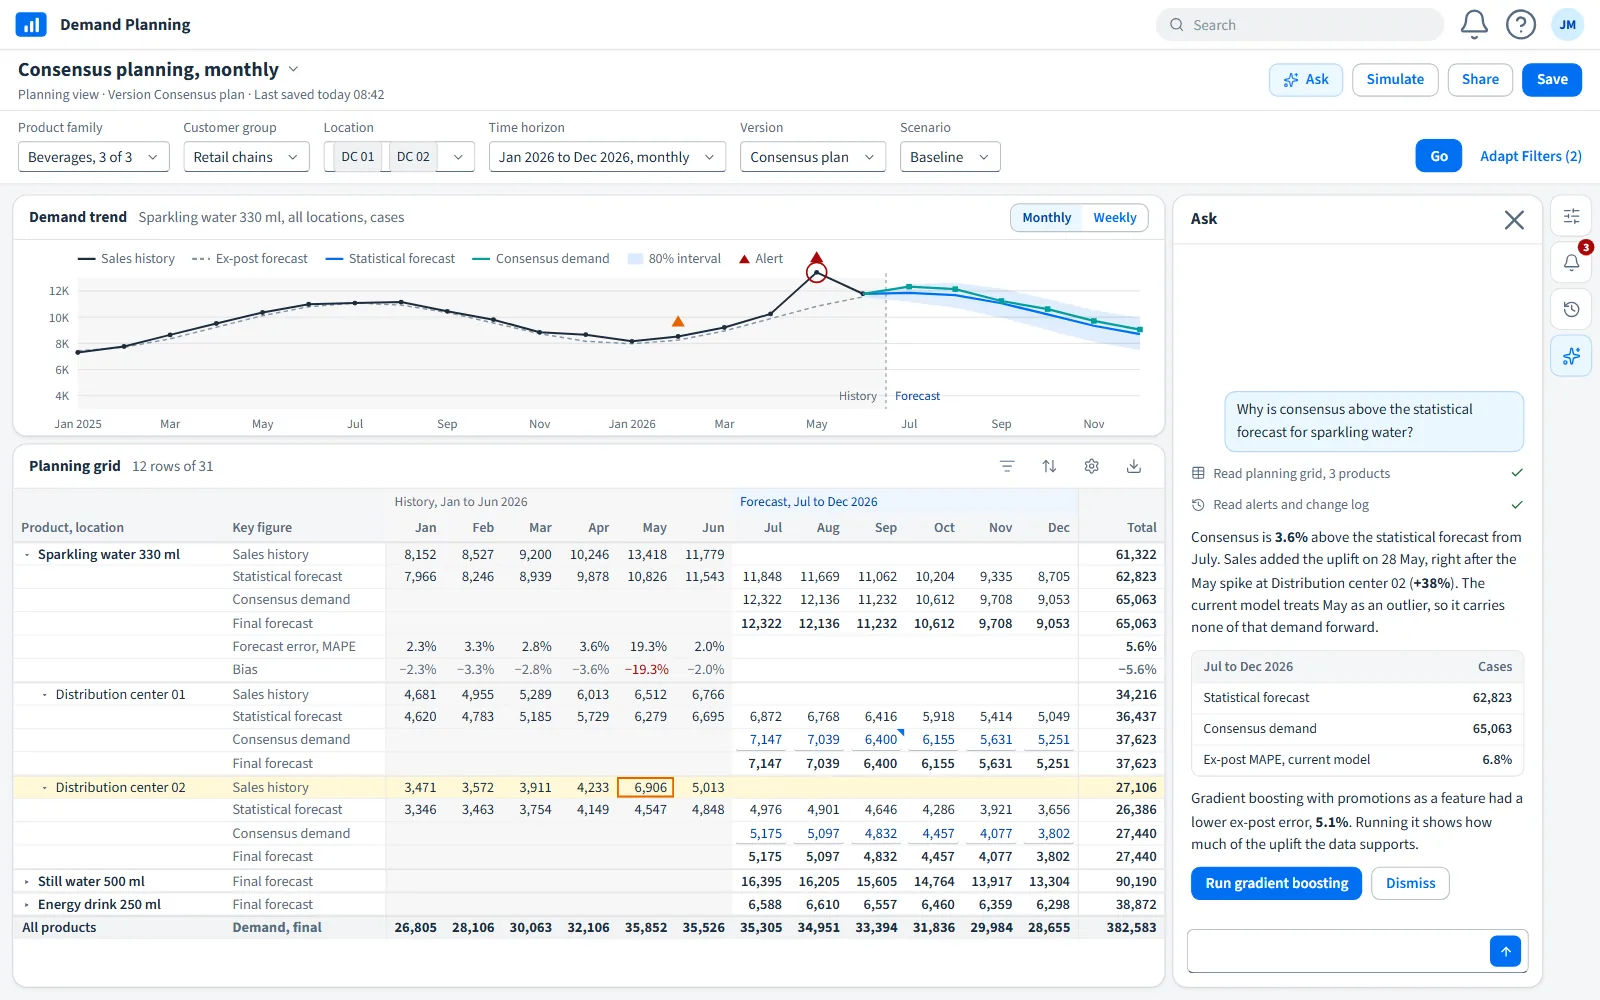
Planners in industry and retail spend their month reconciling three numbers: what sold, what the statistical model forecasts, and what sales and operations agree to plan. This tool keeps all three in one grid, by product and location, month by month, with the past shaded apart from the future.
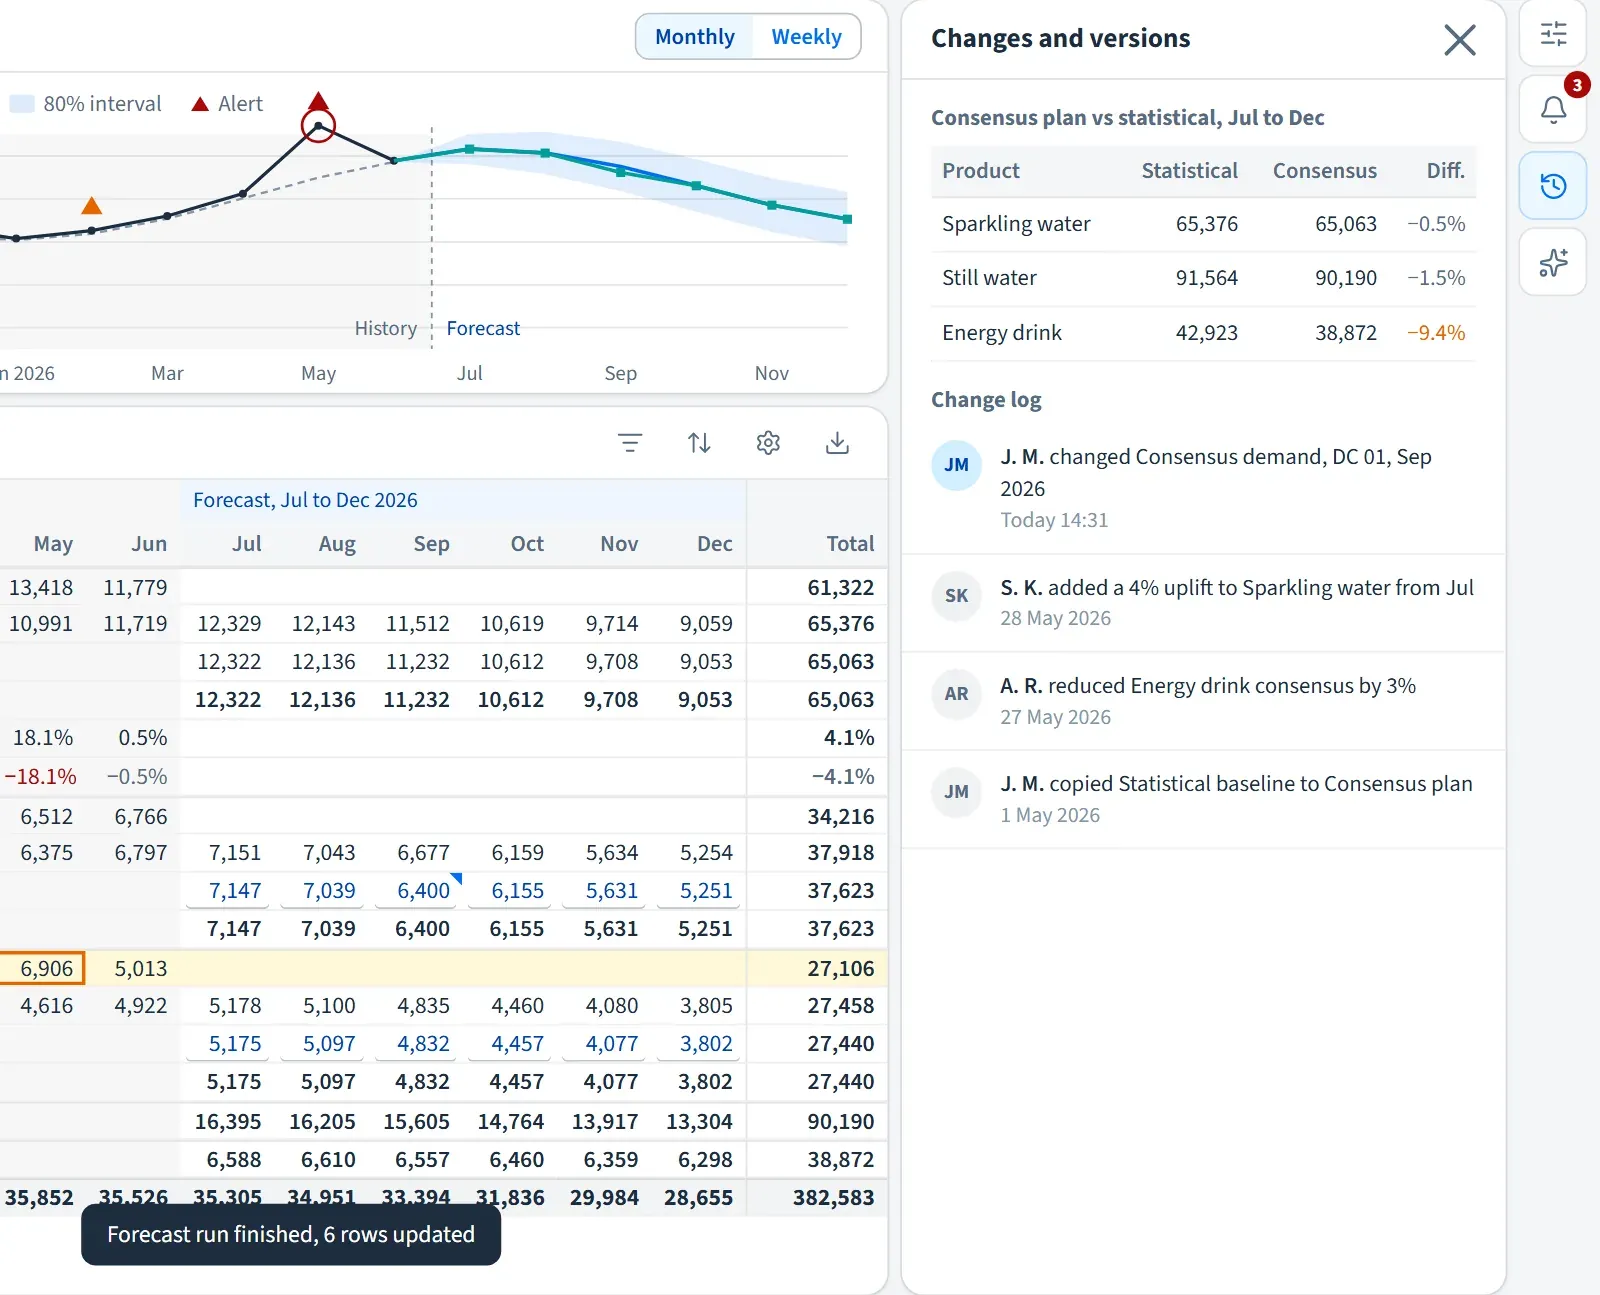
The chart above the grid shows history, the forecast with its 80 % interval, and markers where something needs attention: a demand spike, a forecast biased in one direction, a consensus far from the statistics. Clicking an alert jumps to the cell concerned. A side panel shows which forecasting method was used and how it performed on past months, so a planner can see why the number is what it is before changing it.
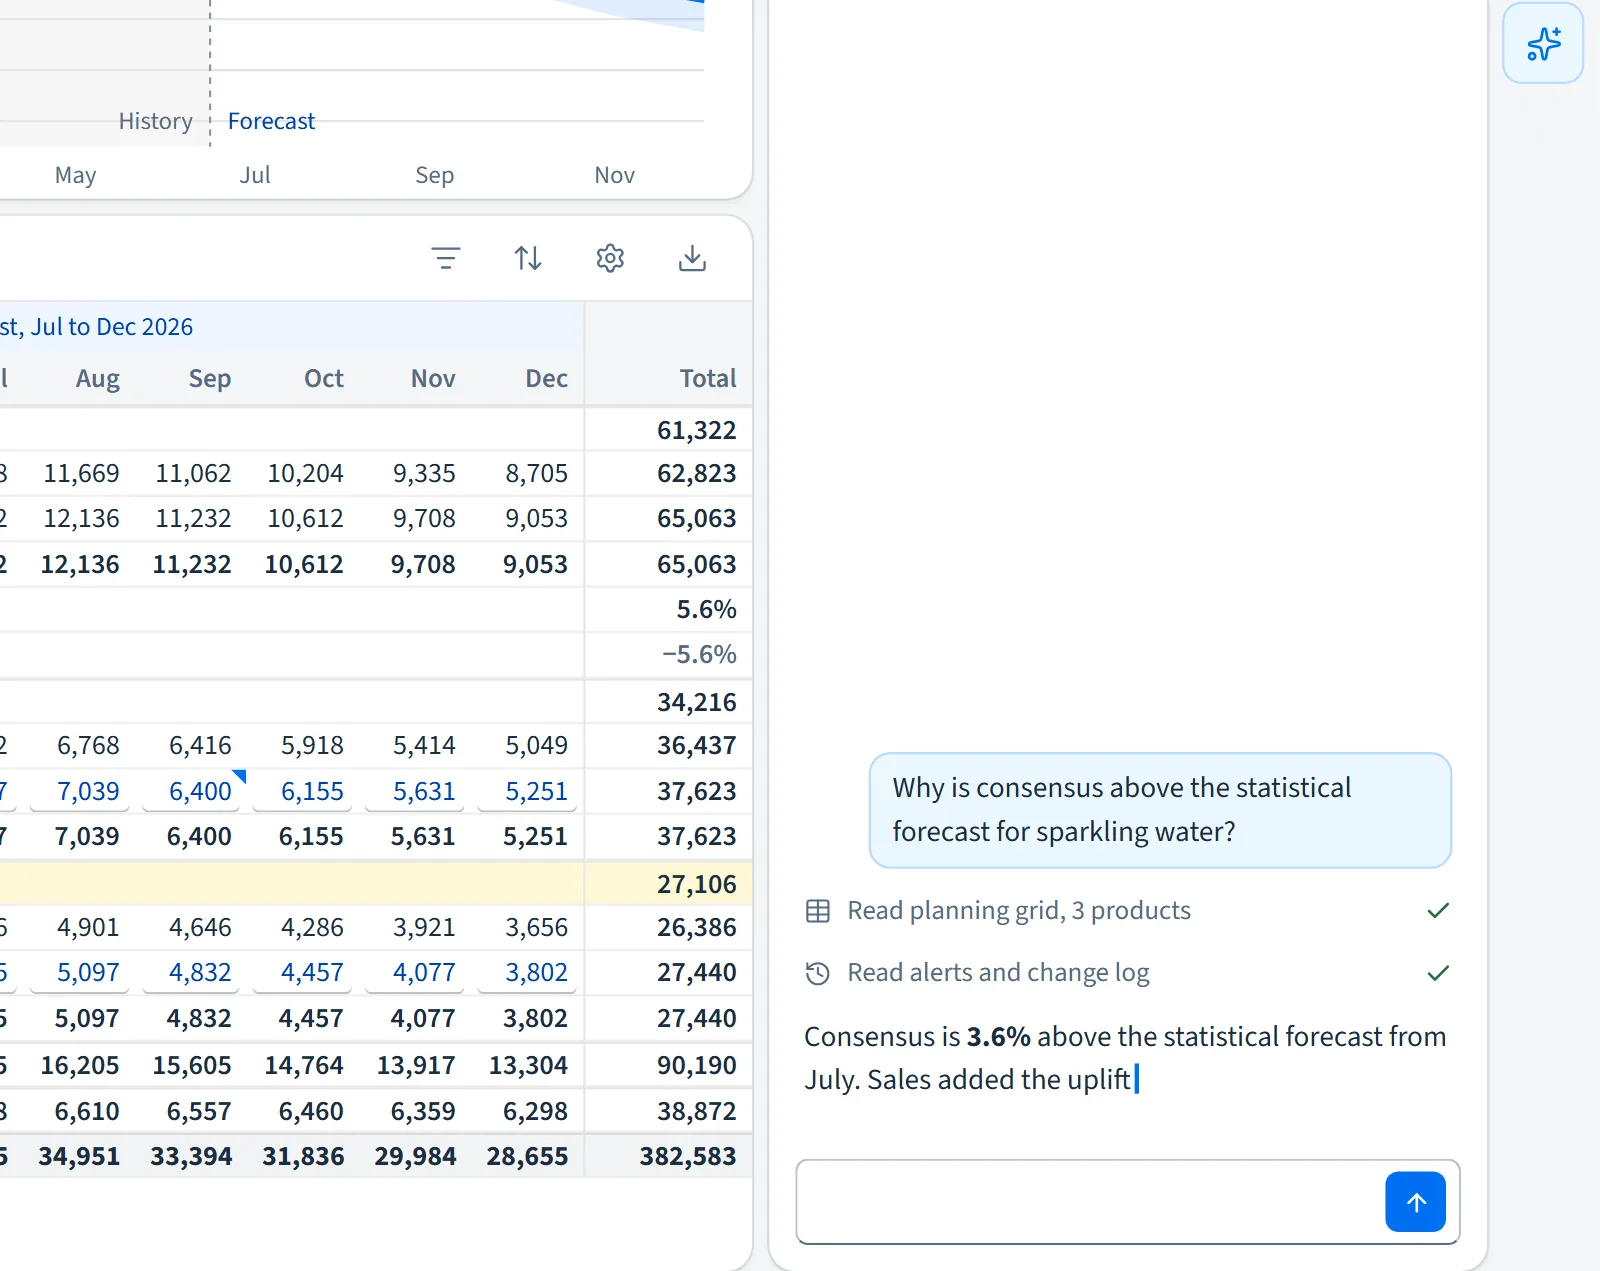
Every edit to the consensus is marked and kept in a change log, versions can be compared, and the assistant explains a forecast in plain words from the figures on the screen.
Demonstration build with generated data. It runs in your browser: open it full screen.
What you get
- 01Filters by product family, customer group, location, horizon, version and scenario
- 02A grid of key figures: sales history, statistical forecast, consensus, final forecast, error and bias
- 03A demand chart with the forecast interval and alert markers
- 04Forecast model settings with past accuracy (MAPE and bias)
- 05Alerts that link to the cell and the chart point concerned
- 06A change log and version comparison
How we work
Every model is tested on data it has never seen: a sealed test set, opened once. Each result comes with its margin of error, and the code is handed over to you.
Have a project like this one? Tell us what you need in a few lines.
Send us the briefAlso in this section
- Customer records and pipelineA CRM built around how your team sells, from first contact to signed deal.
- Model and simulation studioOne workspace where a modelling team sees its data, its pipeline, every training run and the model's behaviour.