

The premise
Most failed models we have seen did not fail on the model. They failed on the table: a column known only after the fact (look-ahead bias), a feed that was not the one the system would run on, a calendar with days that never happened. The error does not show in the code, and the result looks fine until the system meets the world.
So before we fit anything we ask three questions about each input. Where does it come from, and is that the source the system will use in production? When was each value known? Does a second, independent source agree, and on what? The stories below are from our own research since June 2026, most of it on the evaluation of trading strategies for a funded-trader programme, where an account passes if it reaches a profit target before a loss limit. That setting is unforgiving: the outcome is a race between two barriers, and small data errors decide who wins the race.
Two feeds that agree on everything except the answer
In July 2026 we compared two price feeds of the same equity index over the same period (1,402 trading days from 2021), with the same strategy and the same costs. One was the feed of the venue where the strategy would trade. The other was a second price feed with a longer history. On everything we could measure precisely, they were the same instrument: daily returns correlated at 0.986, with a bias of 0.17 basis points a day (t = 0.27); the adverse intraday move that triggers a stop correlated at 0.986 with a median ratio of 1.000; and the share of days that hit the stop was 37.4 % on one feed and 37.7 % on the other.
The share of simulated programmes passed was 0.67 on the venue feed and 0.51 on the second feed.
Nothing was broken. A pass-or-fail race against two barriers amplifies tiny differences: the 2 % of variance the feeds do not share is about 24 basis points a day of noise, compounded over 100 to 250 days. One day that crosses a barrier on one feed and not on the other changes the outcome of the whole window. Figure 1 reproduces the effect in a simulation.
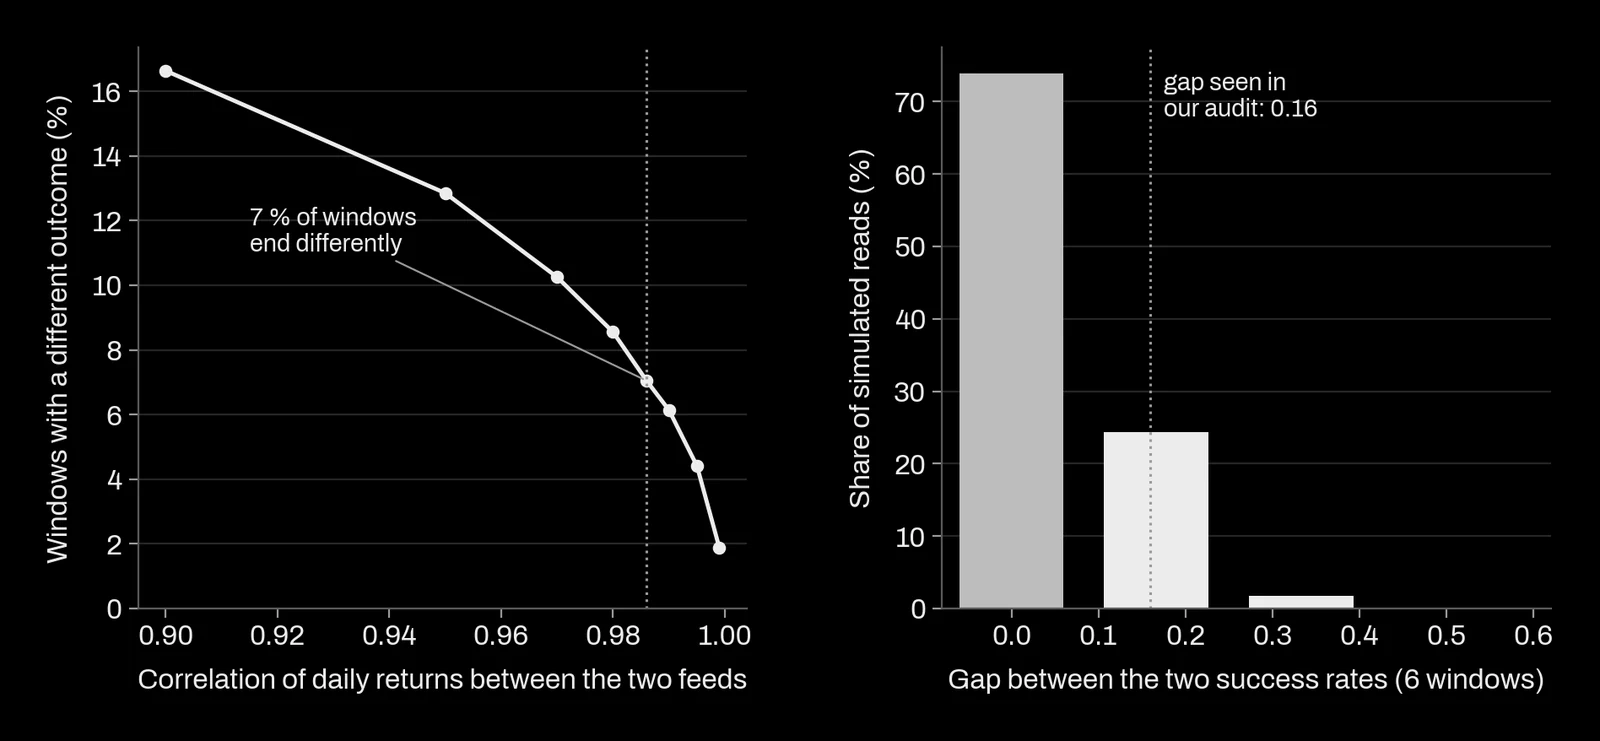
This had a practical consequence. Our strategy register carried a success rate of 0.83 reached in a median of 73 days. The evaluation engine had loaded the second feed, so that number was a level on the wrong feed. On the venue feed the same system gave 0.67, a ruin rate of 0.09 and a median of 141 days. We now hold two rules. The production feed is the judge; other feeds can tell us whether a difference between two systems holds, never what level to expect. And a success rate is reported as an interval tied to its feed, never as a number that travels.
When the data resolution invents the result
The worst error we found in 2026 was a resolution error. Our engine checked whether a stop-loss had been hit by looking at hourly closing prices. A price that dips below the stop and recovers within the hour never shows in a close. On 22 July we rebuilt the engine and checked stops against hourly lows, which we verified against tick data: over 897 days the hourly low matched the tick minimum at the median, to 0.0 basis points.
The share of days that hit the stop went from 38.8 % to 49.8 %. The median stop sat 48 basis points away, on a market whose median hourly range in the busiest session is 28 to 29 basis points: the stop was inside ordinary hourly noise. We applied the corrections one at a time, each written down before the run.
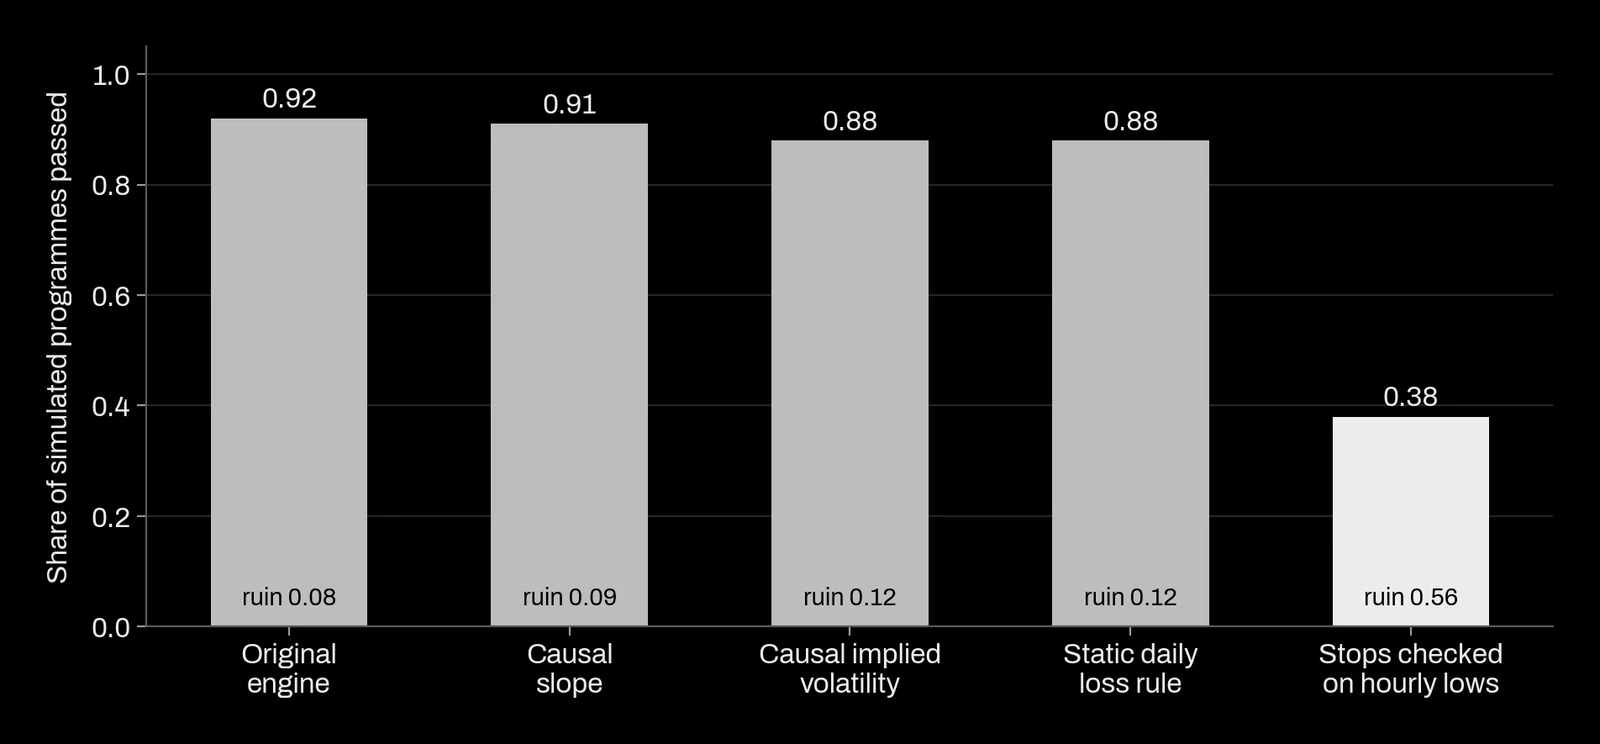
A whole line of results between 0.92 and 0.95 had never existed. To make sure the new engine was right rather than differently wrong, we wrote a second one from scratch: a plain event loop that re-parses the raw files and shares no code with the first. It reproduced 335 out of 335 programme outcomes and durations exactly. We now treat the granularity at which a barrier is checked as a free parameter that can overfit like any other.
Calendars, clocks and days that never happened
Three audits from the same summer show how quiet these errors are.
- Padded days. A long intraday history had 237 filler days out of 1,497 (15.8 %): 212 weekends and 25 holidays, 99.9 % of their bars with zero range. Bars per day and hours covered both looked perfect. The damage spread forward: an expanding quantile used as a volatility threshold saw the zeros and stayed low for years, and the pass rate for 2021 onward fell to 0.37 instead of 0.51. The cheap detector is to count weekends in any new feed.
- Phantom Saturdays. On another feed, a time-zone defect created 262 Saturdays that do not exist and inflated the day count by 17.9 %, so medians in days had to be converted back: 123 index days were about 146 calendar days.
- The wrong clock. We assumed a server clock followed a European daylight-saving calendar. During the weeks when the two sides of the Atlantic change clocks on different dates, the opening spike of the equity exchange stayed at the same server time (27.6 against 25.9 basis points in a normal week). The server followed the exchange's own calendar at a fixed offset. Announcement times in our news filter were re-dated as absolute instants.
Coverage matters too. Hourly bars for several equity indices were in fact daily bars before 2021, so 38 % of the simulated programmes on one index never traded. That index came 84th in a cross-market ranking, then 58th, for reasons unrelated to any strategy. When a result stays identical under several ablations, we now look at the data before the strategy.
Point in time, or what was known when
A forecast made on a given day may only use what was published by that day. Two things break this. The first is revision: many official series are rewritten after release. The public vintage archive we use for macroeconomic series records first releases only from 2010 to 2012, so a series with 55 years of history has about 14 usable years if it is revised. One computed financial-conditions index was revised by 0.70 to 2.05 standard deviations and none of its values stayed as first published; a balance-sheet series from the same release kept 87.8 % of its first values. The question we now ask of every series is whether it is observed or computed. A lag does not fix a revision.
The second is publication delay. In October 2026 an audit of a business-survival bench found 79,383 values served before their publication date: yearly statistics published in September two years after the year they describe were used from January of that second year. One sealed read had used a month of data published two months after it ended. We re-dated every input. A development gain fell from +0.468 to +0.401, a leave-one-country-out count from 28 of 34 to 25 of 34, and the sealed read was declared contaminated and no longer counts.
Language models bring a third kind of leak: they may know the answer. We tested one used as a forecaster on 774 market questions, with no search and no market price, round by round. If it had learned nothing about the outcomes, its accuracy would be at chance. It was not.
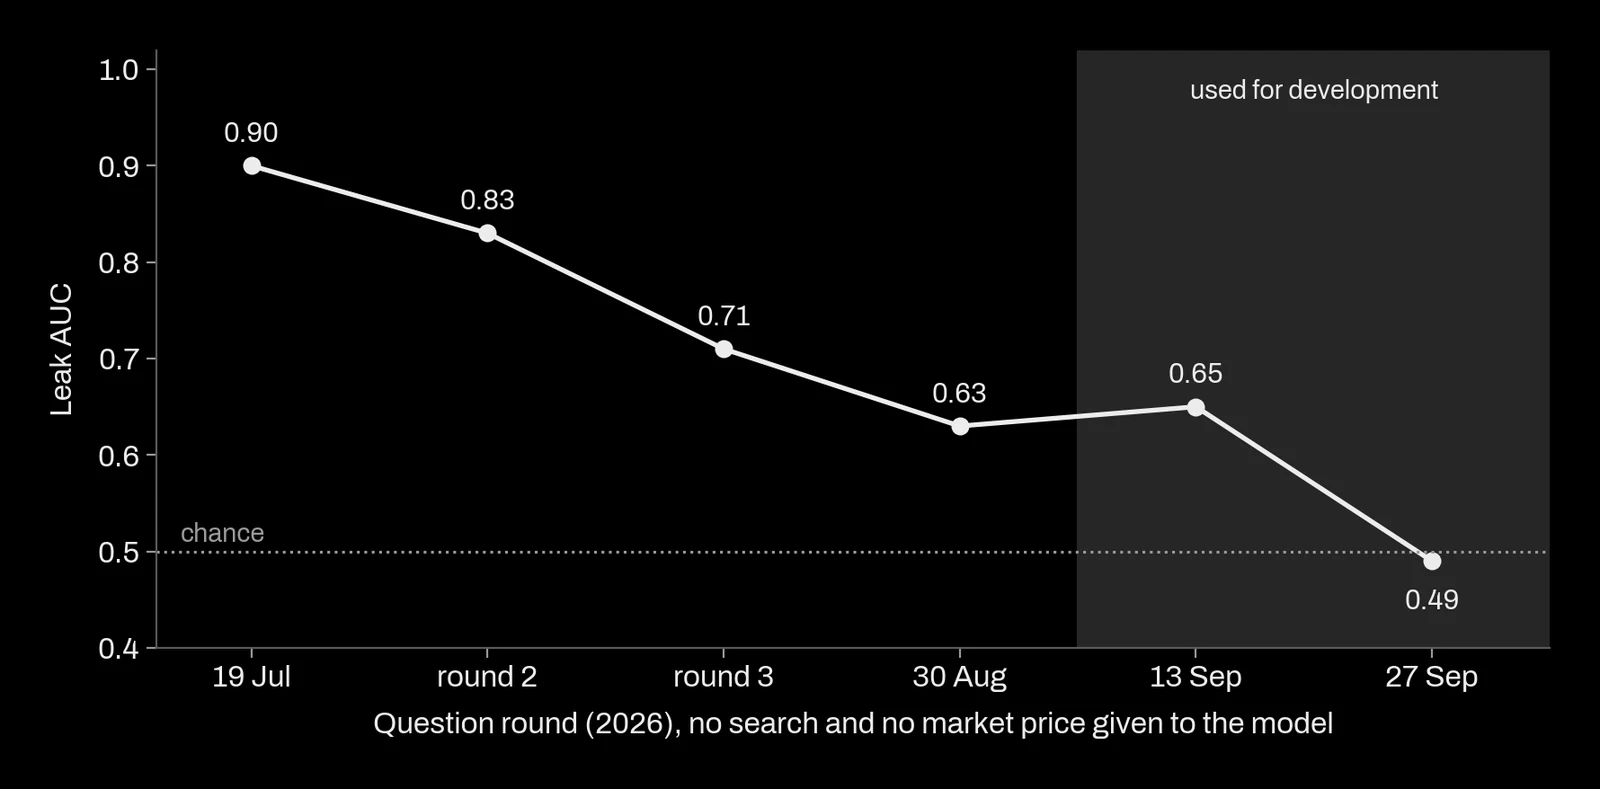
The announced training cutoff was June 2026; the model knew events from August. We no longer take a cutoff date on trust. We measure the leak, with a planted case it must detect, and keep the confirmatory read for questions that resolve after the test.
Inside our own pipelines the check is mechanical. Every feature uses data up to the previous bar, and a test corrupts all future prices and verifies that past decisions do not move by more than 10-12. It fails the run, not a report.
The register of stale facts
Data goes stale, and so do the facts we write about it. Since August 2026 every number or rule we find to be wrong gets an entry in a register with four fields: what we believed, why it fell, what replaces it, and where it was corrected. Fixing it everywhere comes before any other work.
The “where” field taught us the most. The success rate of a strategy with no edge, the baseline everything is compared to, was written as 0.37 in our validation master file in July. On 7 August we measured it with the current engine: 0.269, because the old figure came from a calculation that did not replay the engine. We corrected two notes.
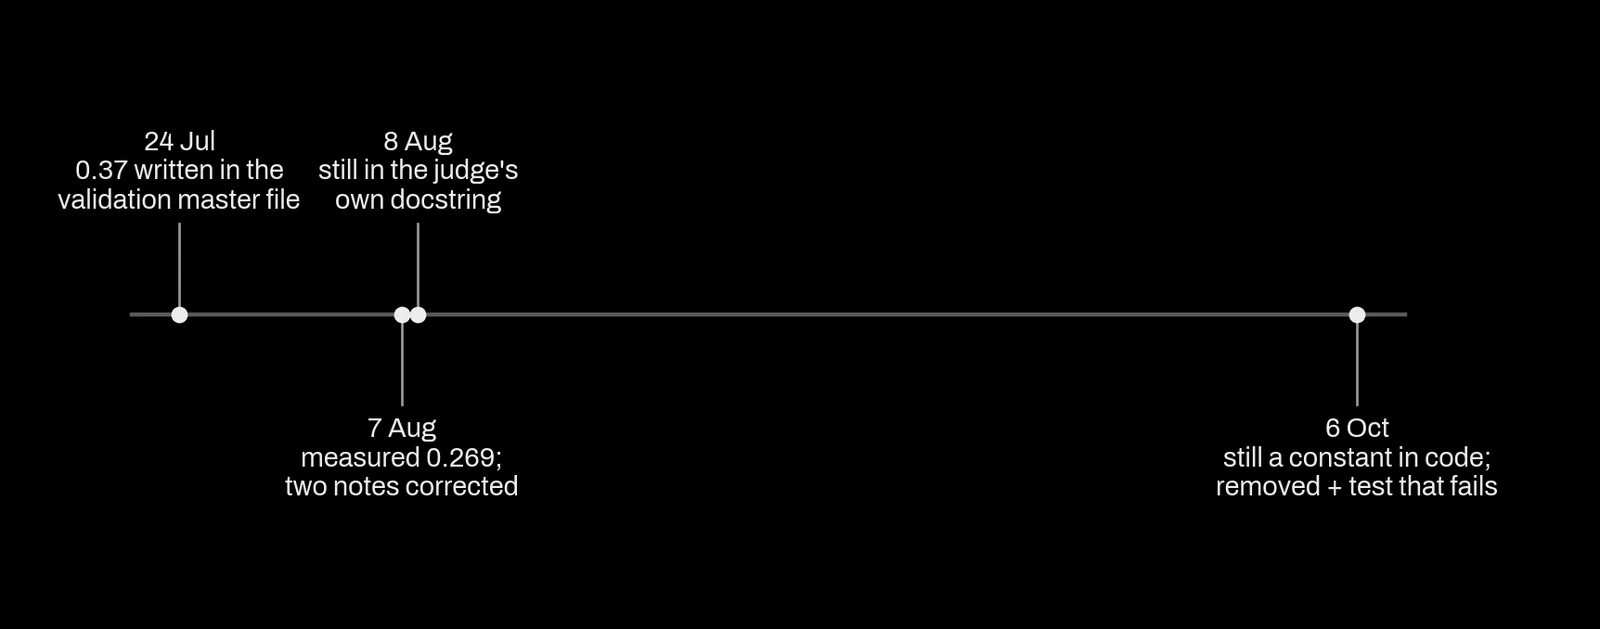
The next day the old value turned up in the documentation string of the evaluation tool itself, the first thing anyone reads before using it. Two months later it was still a constant in code, in a separate working copy. That time we removed it and added a test that fails if a retired value comes back. A similar case: the operator file of a deployed system promised a pass rate of 0.85 in about 70 days, a level from the second feed. Someone reading that file would have concluded after three months that the system was broken. A stale expectation produces a false alarm on a predictable date.
What this means for a project
On a data or forecasting project with us, you receive:
- a data audit before any model: source of every input, publication dates, revisions, coverage, filler days and time zones, with the checks written as tests that run on every refresh;
- results computed on the data your system will use in production, with any other source labelled as such;
- a point-in-time history where the data allows one, and a statement of how far back that is possible when it does not;
- a register of corrections: when a figure we gave you changes, you get the old value, the reason and the new value.
What we refuse to claim: a level measured on one source as if it held on another, a backtest on series that were revised after the fact, or an accuracy figure for a language model on questions it may already know.
References
- Kaufman, S., Rosset, S., Perlich, C. and Stitelman, O. (2012). Leakage in data mining: formulation, detection, and avoidance. ACM Transactions on Knowledge Discovery from Data 6(4). doi:10.1145/2382577.2382579
- Bailey, D. H. and López de Prado, M. (2014). The deflated Sharpe ratio: correcting for selection bias, backtest overfitting and non-normality. The Journal of Portfolio Management 40(5). doi:10.3905/jpm.2014.40.5.094