

Why we publish this
From September to November 2026 we ran our forecasting and machine-learning work against public benchmarks: a motor insurance claims dataset, two forecasting tournaments, a conflict forecasting system and several internal benches built on public data. A benchmark is the cheapest way to find out whether a method beats what already exists, because someone else chose the data and the scoring rule.
It is also easy to fool yourself with one. You can pick the best of many variants after seeing the scores, compare against weak baselines, or use a model that has already seen the answers. We made all three mistakes at least once. This note gives the numbers we would stand behind today, the numbers we had to withdraw, and what each one is worth.
We hold ourselves to three conditions before calling a result firm. The score is read once on a sample sealed before the work started. It is paired against the best available reference on the same items, with an interval. And someone else can rerun it from the code and get the same number. On 9 November 2026, none of our results meets all three. Most are provisional, a few are empty, and we say which.
Motor insurance claim frequency
The French motor third-party liability dataset (freMTPL2) is a standard public benchmark for claim frequency: about 678,000 policies, with the number of claims as the target and Poisson deviance as the score. Actuaries use it to compare generalised linear models with machine learning. Lower deviance is better.
Our first model, a gradient-boosted Poisson model, scored 23.551 (deviance times 100) on the test split. Against the reference generalised linear model of the standard case study (GLM3, Noll et al., 2018), refitted on the same split, the paired gain per policy was -0.551, with a 95 % interval of -0.671 to -0.434. That gain is clear. Against the best published score we could find, 23.577, our number is lower by 0.026, but that comparison is not paired: the authors did not publish their predictions, so we cannot put an interval on it.
A second round tried about eight ideas and none helped (+0.0002, interval -0.0021 to +0.0026). A third round, which combined seven model families, reached 23.5439, a paired gain of -0.0070 against our own first model, interval -0.0140 to -0.0005. The development folds predicted that test gain to within 0.0003.
The limits. The test split was read three times, once per round, so it is no longer sealed; each read leaks a little information into the next choice. The model is a generic one; nothing in it is specific to our methods. The third-round gain is small, and an outside review scored it as a modest positive without established superiority. An earlier number we had reported, 23.667, came from a bug and was withdrawn.
Forecasting tournaments: the place depends on the choice
Forecasting tournaments ask questions about future events (an election result, a price on a date, a count of incidents) and score probabilities with a proper scoring rule such as the Brier score. We replayed three past rounds of one public tournament, with 203, 234 and 304 participants, using questions that had already resolved. We never posted forecasts in those rounds; this is a retrospective replay.
Figure 1 shows why a single place means little. If we take the best of our variants after seeing the scores, we rank 26th, 9th and 24th. If the variant is chosen by cross-validation on earlier rounds, as it would have been in real time, we rank 27th, 19th and 32nd: selection alone was worth 1 to 10 places. If we run the exact code that would have been deployed, including one model member that failed often, we rank 34th, 19th and 48th.
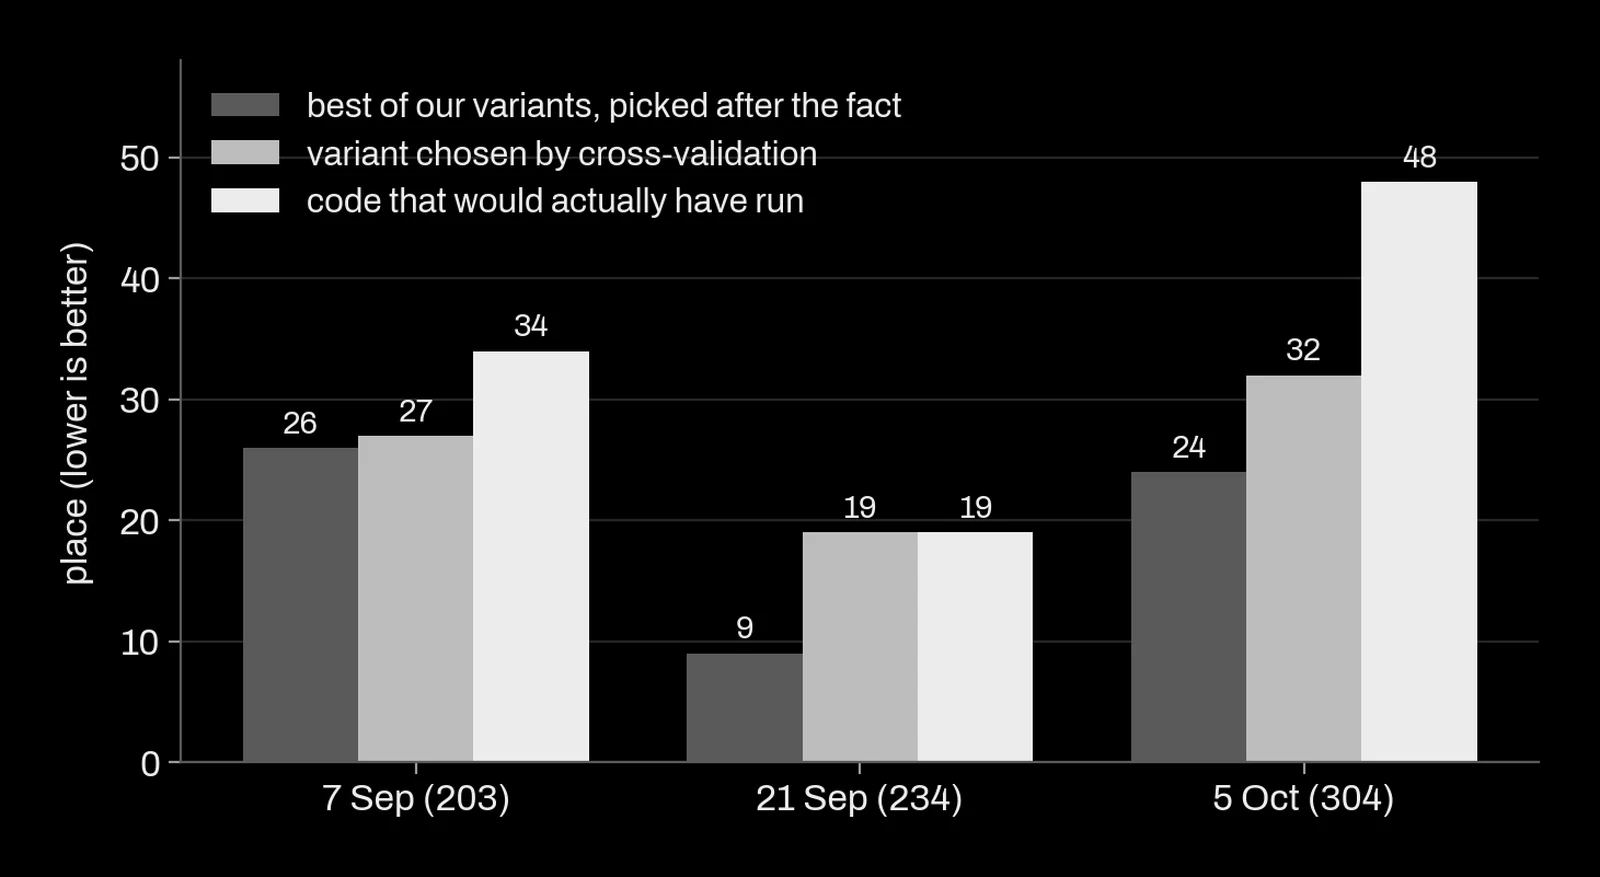
The place we quote is the middle one, 32nd of 304 on the most recent round, and we quote it with the others. On a second tournament with 464 entries, the same honest procedure put our stack 58th, and the optimism from picking after the fact was worth 0.0064 Brier points. On that benchmark one version of our model came out empty: none of the three positive controls we planted were detected, so the test could not have seen an effect even if there was one. We report it as empty, not as a failure and not as a success.
The limits. Replays are not live submissions. The rounds are few, so a place moves by several ranks from noise alone. And part of what remains is explained by the next section.
When the model already knows the answer
Language models are trained on text up to some date. If a tournament question resolved before that date, the model may simply remember the outcome. The training cut-off announced for a model is not a safe boundary; we measured it instead.
The test is simple. We asked a model to forecast 774 resolved questions with no search, no prices and no context, only the question. If it has no memory of the outcome, its discrimination should be at chance, an AUC of 0.5. On questions from mid-July 2026 it scored 0.90, and its Brier score (0.108) matched the market price (0.104) without seeing the price. The AUC fell round after round and reached 0.49 only on questions from late September (Figure 2). The model knew of events about two months later than its announced cut-off. A second model from another provider showed the same pattern.
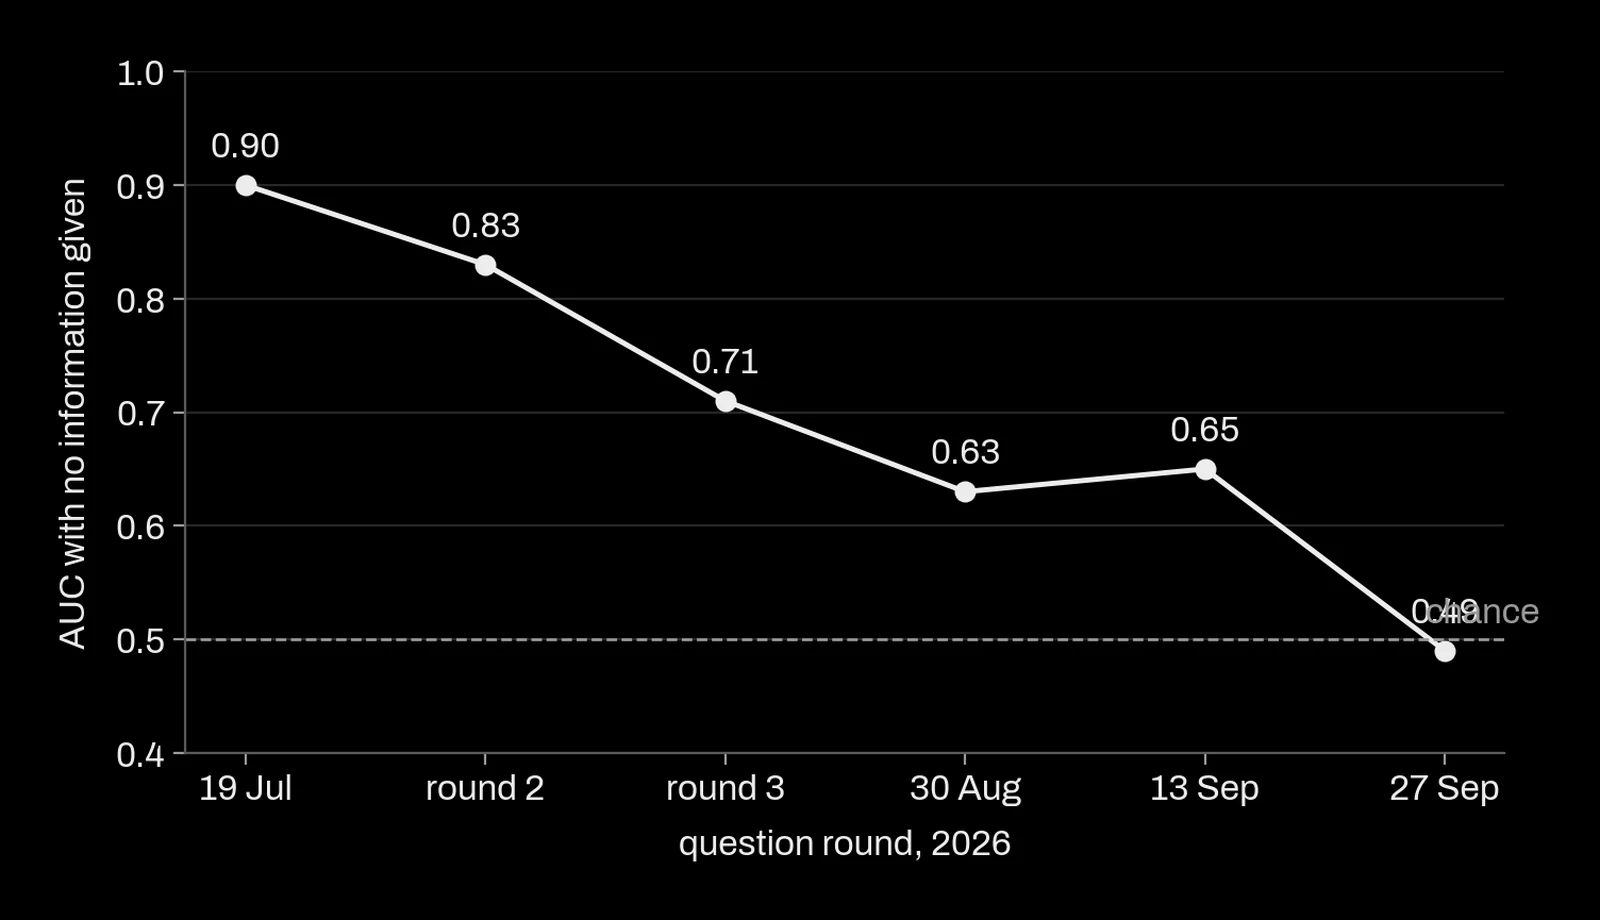
Since then, every result that uses a language model is restricted to questions after the measured boundary, and a confirmatory result needs a round that resolves after the work is frozen. Part of the replayed tournament places above comes from older rounds, where memory helps; most of the advantage it gave on older rounds disappeared on the most recent one.
Weak baselines make easy wins
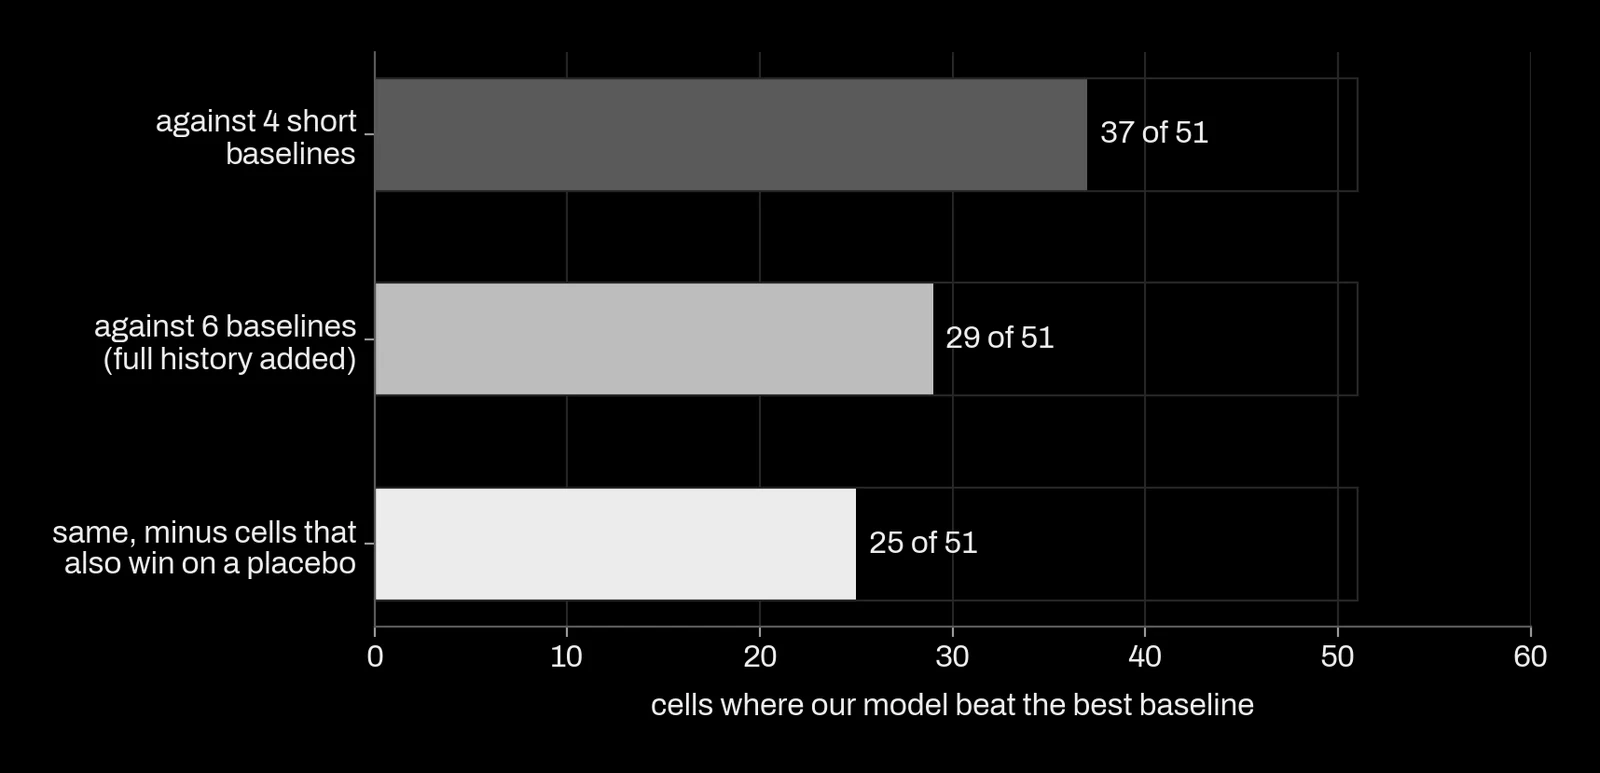
On an internal benchmark of 51 cells (claims and loss series from public sources, several horizons each), our model first beat the best of four baselines in 37 cells. Those baselines were short: the same month last year, the last twelve values. When we fed pure noise to the stack, it still beat them, by 6.4 %, simply because it averaged over more history. That gain had nothing to do with skill.
We added two longer baselines, the whole visible history and the last 36 values. The count fell to 29 of 51. Removing the cells that also won under a seasonal placebo left 25 (Figure 3). On the subset where every input was strictly dated, the model led in 4 of 11 cells. A sealed read for 2019 to 2025 was frozen but has not been opened, so even 25 is a development number.
Conflict forecasting: persistence is hard to beat
We also tested monthly forecasts of conflict fatalities against a public early-warning system and its published models. In a realistic audit our best combination ranked 2nd of 21, tied with the best country-level model: the difference was 0.057 with a standard error of 0.32, so no ranking between the two can be claimed.
The more useful finding was negative. Outside one country with large swings, the naive forecast that next month looks like this month was first, and nothing we tried beat it. Adding a news-event feed made forecasts slightly worse (+0.017, p = 0.80). One single-month live read was declared in advance, but a single month has no statistical power.
Results that came out empty
Some work produced nothing, and we keep it on the record. One early-warning classifier, read once on its sealed sample in October, scored an AUC of 0.504, which is chance; the persistence forecast beat it on Brier score (0.1160 against 0.1190). Another sealed read missed its pre-registered coverage target (67.4 % against 80 %), so it is empty under the rule we wrote before looking, whatever the descriptive gain says. An apparent win in a pairwise duel came from tail insurance rather than from the mechanism we were testing. A tournament score of 0.217 against 0.272 turned out to be an effect shared by every entry in that round and was withdrawn.
| Benchmark | What we measured | Status | Main limit |
|---|---|---|---|
| Motor claim frequency | -0.551 [-0.671; -0.434] against the reference GLM; 23.544 best score | Provisional | Test split read three times; no paired comparison with the best public score |
| Tournament replay | 32nd of 304, 19th of 234, 27th of 203 (honest choice) | Provisional | Replay, never posted; older rounds favour models with memory |
| Second tournament | 58th of 464 (honest choice) | Provisional; one version empty | Positive controls not detected in one version |
| Internal claims and losses bench | 25 of 51 cells | Provisional | Sealed years not opened yet |
| Conflict fatalities | 2nd of 21, tied with the best | Provisional | Tie; persistence wins outside one country |
| Early-warning classifier | AUC 0.504 on sealed sample | Empty | None; read once |
| Interval forecast | Coverage 67.4 % against 80 % target | Empty | Gate missed as pre-registered |
| News feed for conflict | +0.017, p = 0.80 | Negative | Below the detectable effect |
What we changed after these benchmarks
- We quote the place or score of the variant chosen by a rule fixed in advance, never the best variant seen afterwards, and we give the gap between the two.
- Every comparison includes long, plain baselines: the full history, persistence, a seasonal average. A model that cannot beat them on noise-free terms does not get reported as better.
- Before using any language model on dated questions, we measure its memory with a leak test, and only questions after the measured boundary count.
- A test whose positive controls are not detected is reported as empty. It is not a negative result, and it is not a pass.
- Intervals come from the right unit. Clustering by the wrong identifier once made our intervals five times too narrow; we now check every interval method on a placebo first.
The methods behind these rules are described in Our gates and Detecting overfitting.
What this means for a project
When we benchmark a model for you, you receive:
- the score against the strongest plain baseline, paired item by item, with its interval;
- the number of variants tried and the gap between the chosen one and the best one seen;
- a sealed sample that is opened once, at the end, and a note if it had to be opened more than once;
- a leak test for any model trained on outside text;
- the results that came out empty or negative, listed next to the ones that worked.
What we will not do: quote a leaderboard place picked after the fact, compare against a baseline chosen because it is easy to beat, or present a provisional number as a firm one.
References
- Noll, A., Salzmann, R. and Wüthrich, M. V. (2018). Case study: French motor third-party liability claims. SSRN working paper. doi:10.2139/ssrn.3164764
- Karger, E., Bastani, H., Yueh-Han, C., Jacobs, Z., Halawi, D., Zhang, F. and Tetlock, P. E. (2024). ForecastBench: a dynamic benchmark of AI forecasting capabilities. arXiv 2409.19839. arXiv:2409.19839
- Hegre, H. et al. (2019). ViEWS: a political violence early-warning system. Journal of Peace Research 56(2). doi:10.1177/0022343319823860
- Cawley, G. C. and Talbot, N. L. C. (2010). On over-fitting in model selection and subsequent selection bias in performance evaluation. Journal of Machine Learning Research 11. jmlr.org/papers/v11/cawley10a
- Sainz, O., Campos, J. A., García-Ferrero, I., Etxaniz, J., Lopez de Lacalle, O. and Agirre, E. (2023). NLP evaluation in trouble: on the need to measure LLM data contamination for each benchmark. Findings of EMNLP 2023. doi:10.18653/v1/2023.findings-emnlp.722