

What it is
We forecast demand, volumes, load and prices, from the next day to the next year, and we run statistical studies for public bodies: survey design, weighting and estimates for small areas.
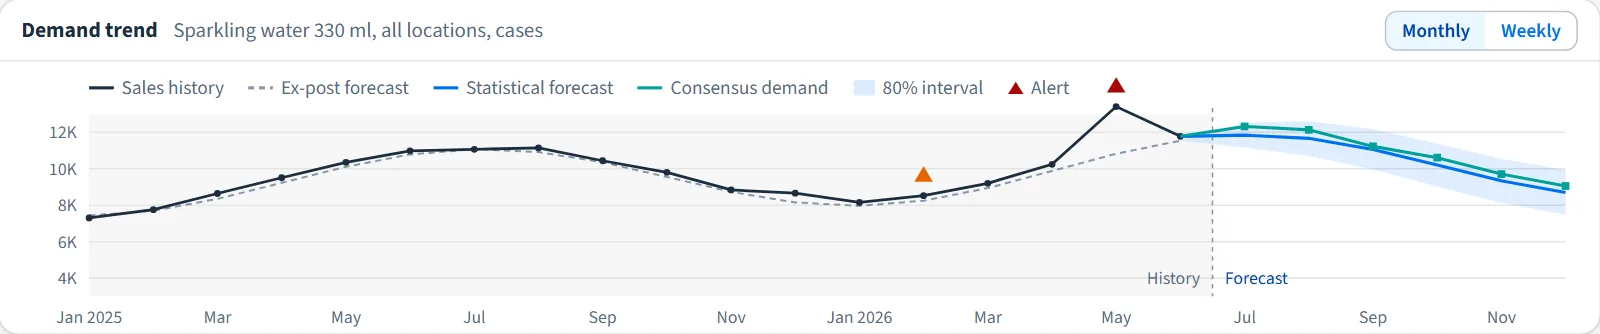
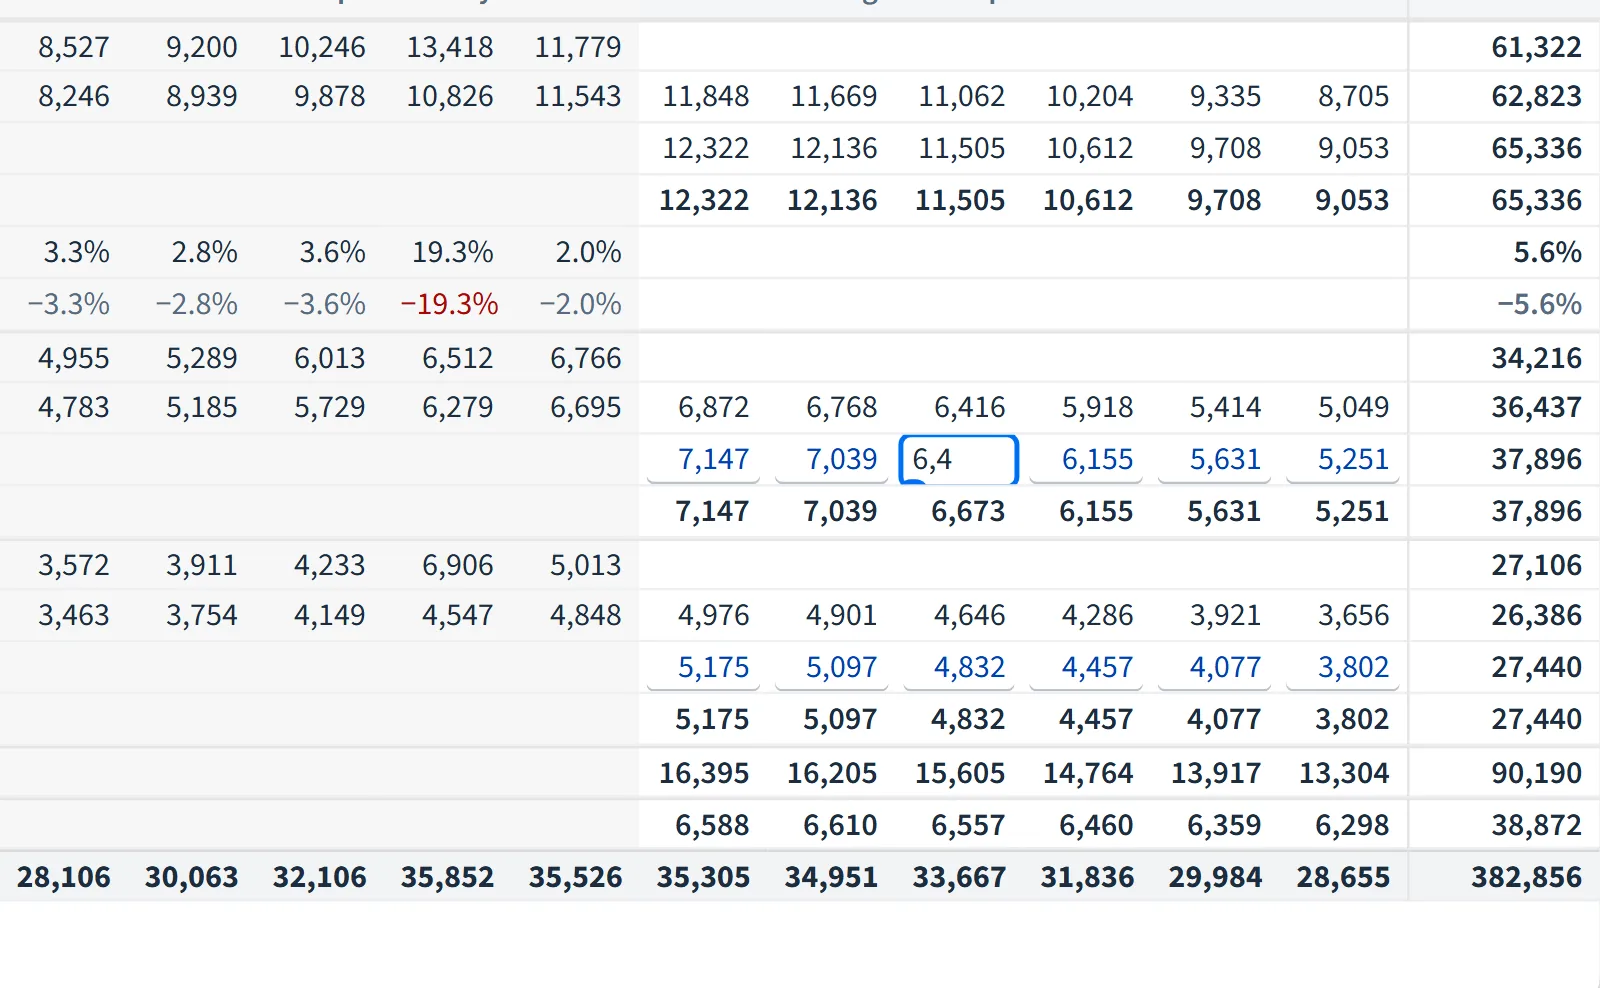
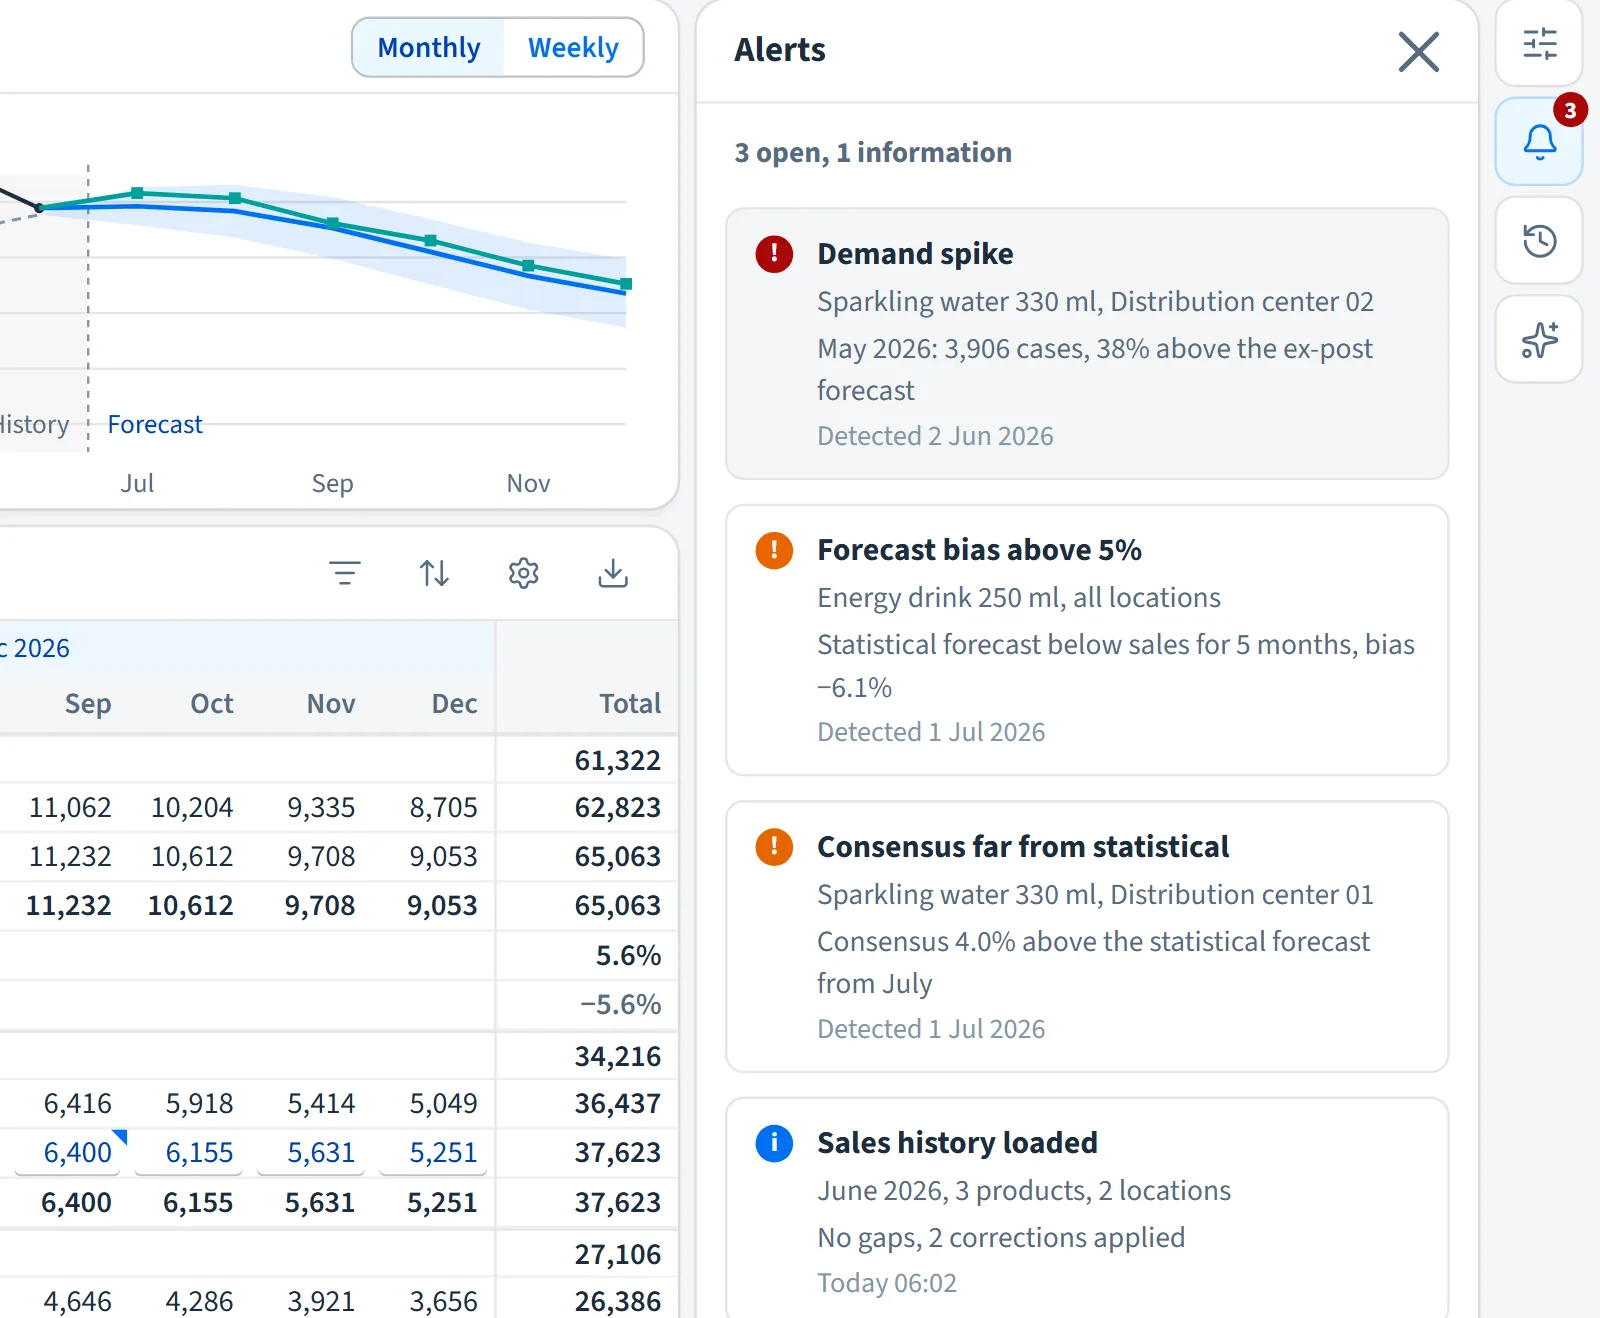
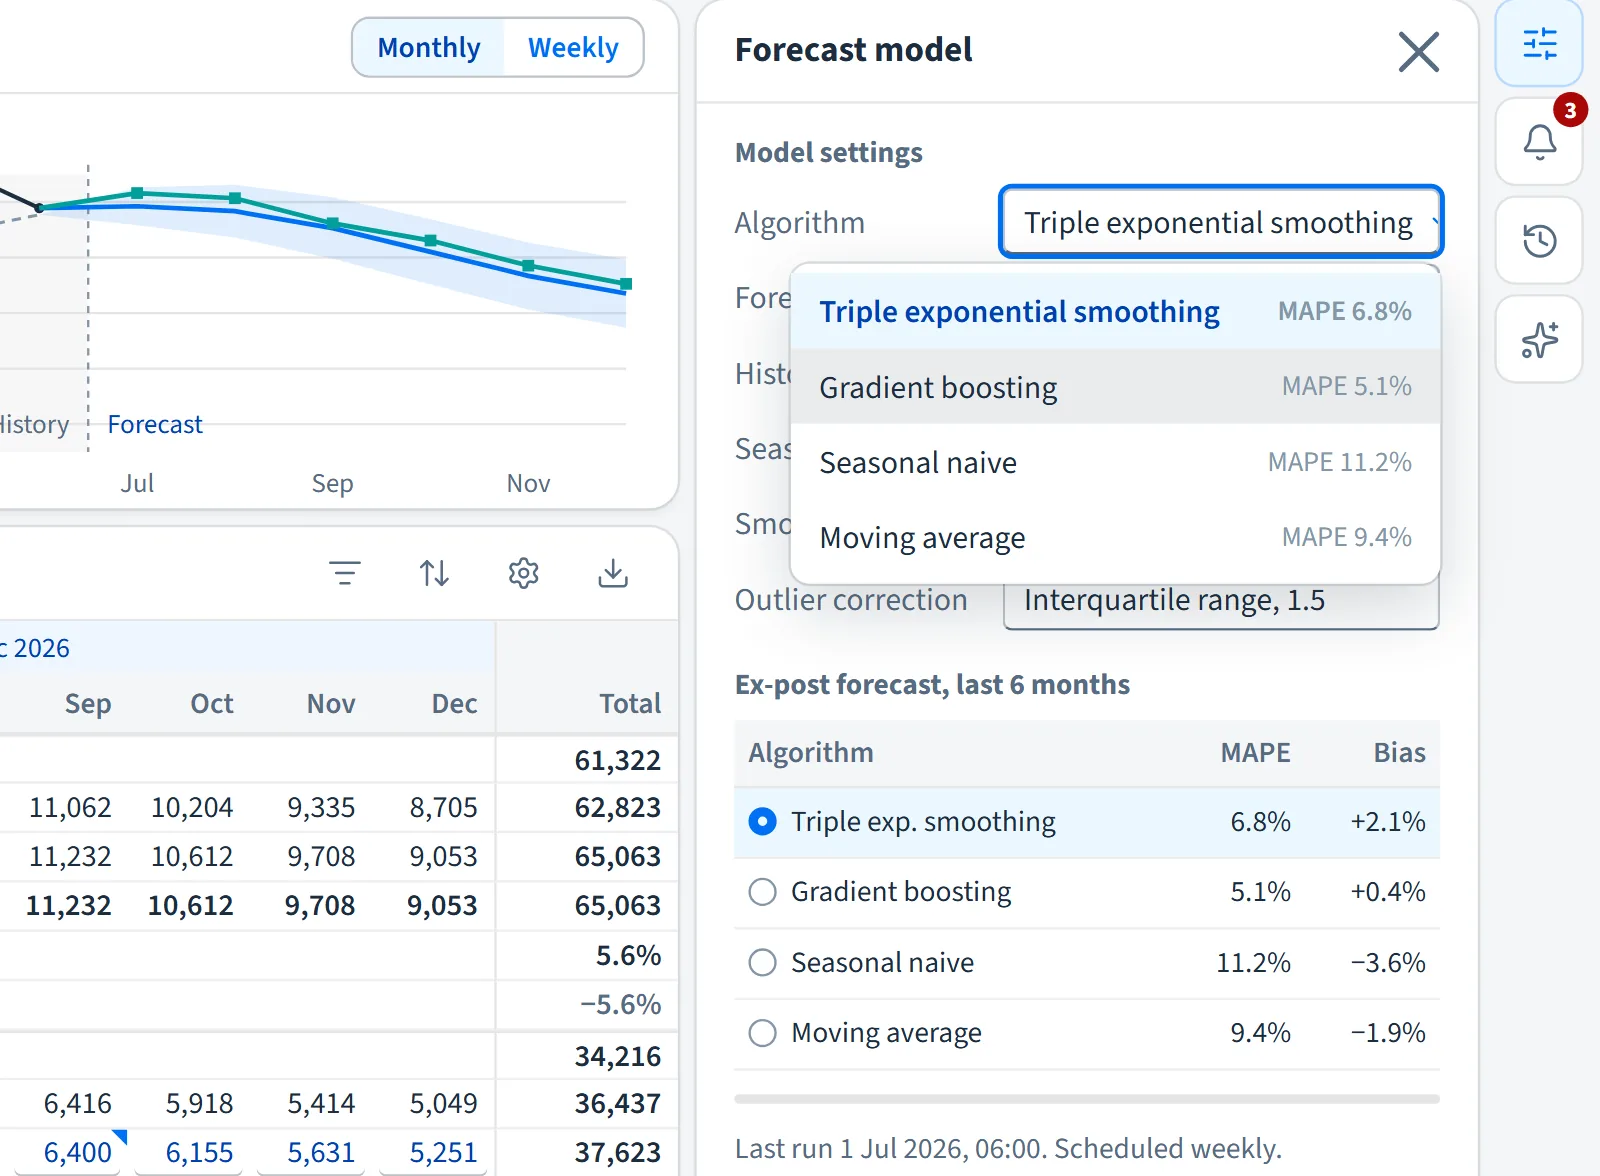
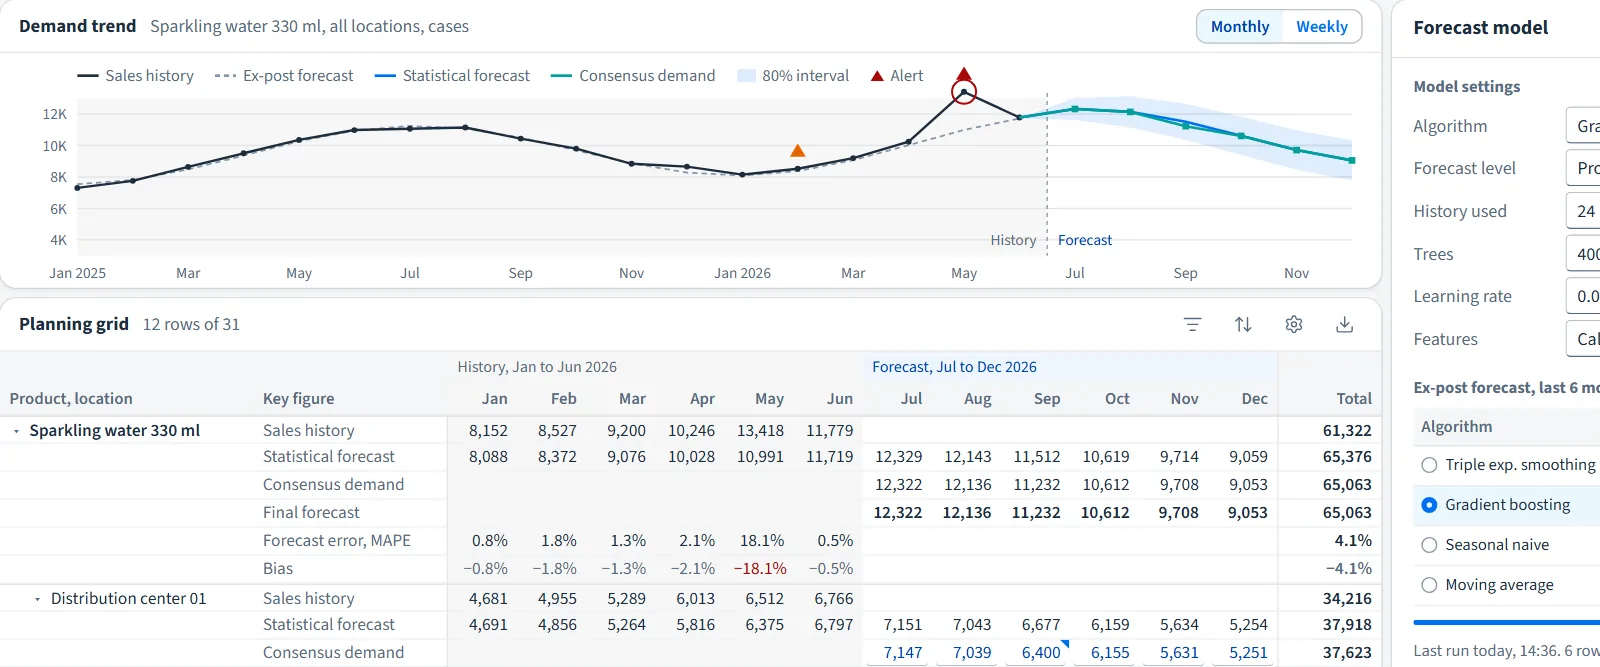
Every forecast comes with a range and with a record of how the method did on a period it never saw. The screens below come from a demand planning tool we built for our portfolio.
What makes a forecast usable
A range, not a single number
A single number hides how uncertain it is. We give each forecast as a range, for example an 80 % interval, and check that the ranges are honest: over a test period, about 80 % of actual values should fall inside the 80 % range. If only 60 % do, the ranges are too narrow and we widen them before you plan with them.
Tested as if on the day
We test a forecasting method by replaying the past: on each date of a test period, the method sees only the data that existed that day and forecasts ahead, then we compare with what happened. Data that was revised later, such as corrected sales or restated figures, is used in its original version. This gives an accuracy record you can expect to see again in use.
Forecasts that add up
When you forecast by product, region and month, the detailed forecasts should add up to the totals. Forecasting each level separately breaks that. We forecast all levels and reconcile them, so the regional figures sum to the national one and planners at each level work from the same numbers.
Forecast, plan and scenarios
A forecast says what is likely to happen; a plan says what you intend to do. We keep the two apart and show the gap between them. Scenarios change a few clearly named drivers, such as price, volume or a hiring date, and show how the forecast moves, so a discussion about the downside is a discussion about a number.
Surveys and local estimates
Public bodies often need figures for small areas where survey samples are thin. We design surveys from the margin of error you need, weight responses to match the population, and use small-area estimation to borrow strength from neighbouring areas and from administrative data. Every local figure comes with its own margin of error, and figures too uncertain to use are marked as such.
Example build
Demonstration builds made for our portfolio, running on generated data. No client data is shown.
What you receive
What a project of this kind typically hands over. The exact list is set in the written scope.
Ranges that are honest
We check that the ranges contain what they claim before you plan with them.
A record of past accuracy
How the method would have done, measured as if on the day.
Forecasts that add up
Every level of your hierarchy works from the same numbers.
Scenarios on named drivers
A discussion about the downside becomes a discussion about a number.
Surveys and local estimates
Figures for small areas, each with its margin of error.
The code and the data trail
Everything needed to rerun the forecast and the back-test.
How a project runs
Typical timings. Your scope sets the real ones.
Week 1
What to forecast and why
The figures, levels and horizons that feed a decision, and how wrong a forecast can be before it costs money.
Weeks 2 to 3
History and vintages
The past data as it was known at each date, and a simple benchmark forecast.
Following weeks
Methods replayed on the past
Candidate methods tested day by day on the past, ranges checked for honesty.
Delivery
Forecasts in your planning
Forecasts with ranges delivered where planners work, refreshed on schedule.
After delivery
Accuracy report
Each period, forecasts are compared with what happened and the record is shared with you.
Have a project like this one? Tell us what you need in a few lines.
Send us the briefOther services
- Custom software and internal toolsSoftware built around the way your team already works, not the other way round.
- Platforms, dashboards and client portalsMulti-user platforms where your clients, partners or staff log in and get their own view.
- Websites and web appsFast websites and web apps that work on every screen and in several languages.
- Data pipelines and CRMClean, connected data and a CRM your sales team actually keeps up to date.
- Machine learning and AIScoring, classification and text models, used only where they beat a simpler tool.